I went down a YouTube rabbit hole the other day and ended up watching a bunch of Andy Math videos, where he solves math problems. They always look so simple at first, before he gets into solving the actual problem using the lessons I had forgotten long, long ago from middle and high school.
Anyways, that got me thinking about wins above replacement (WAR). It’s become this catch-all stat that attempts to sum up a player’s value in comparison to any other player, in any era, using complex statistics and boil it all into one number. Fans of any background now use this stat. Old-school, batting average, home run and RBI guys. New school OPS, weighted runs and launch angle guys.
And it is so easy. It makes sense. Babe Ruth is the all-time leader in WAR with 182.6. That makes sense. Tim Anderson had a terrible season last year and had a WAR of -2.0. That also makes sense. So then it’s agreed, WAR is a good stat. Just one thing…
How the f&$@! is it calculated?
This goes back to Andy Math. Look at the below formula for WAR and you’ll see it seems pretty straightforward like that top pic:
WAR = (Batting Runs + Base Running Runs +Fielding Runs + Positional Adjustment + League Adjustment +Replacement Runs) / (Runs Per Win)
But you have to know how to get all of those stats. So then your composition notebook starts to get into page after page of solving the problem.
Batting runs is no longer just how many times you crossed the plate. Now it’s a formula that involves linear weights, park and era adjustments and division.
Let’s see if I, who failed both statistics and calculus (twice) in school before finally limping across the 70% threshold, can explain just what the hell is going on here. I’m going to be using Fangraphs version of WAR, explained here: https://library.fangraphs.com/war/war-position-players/
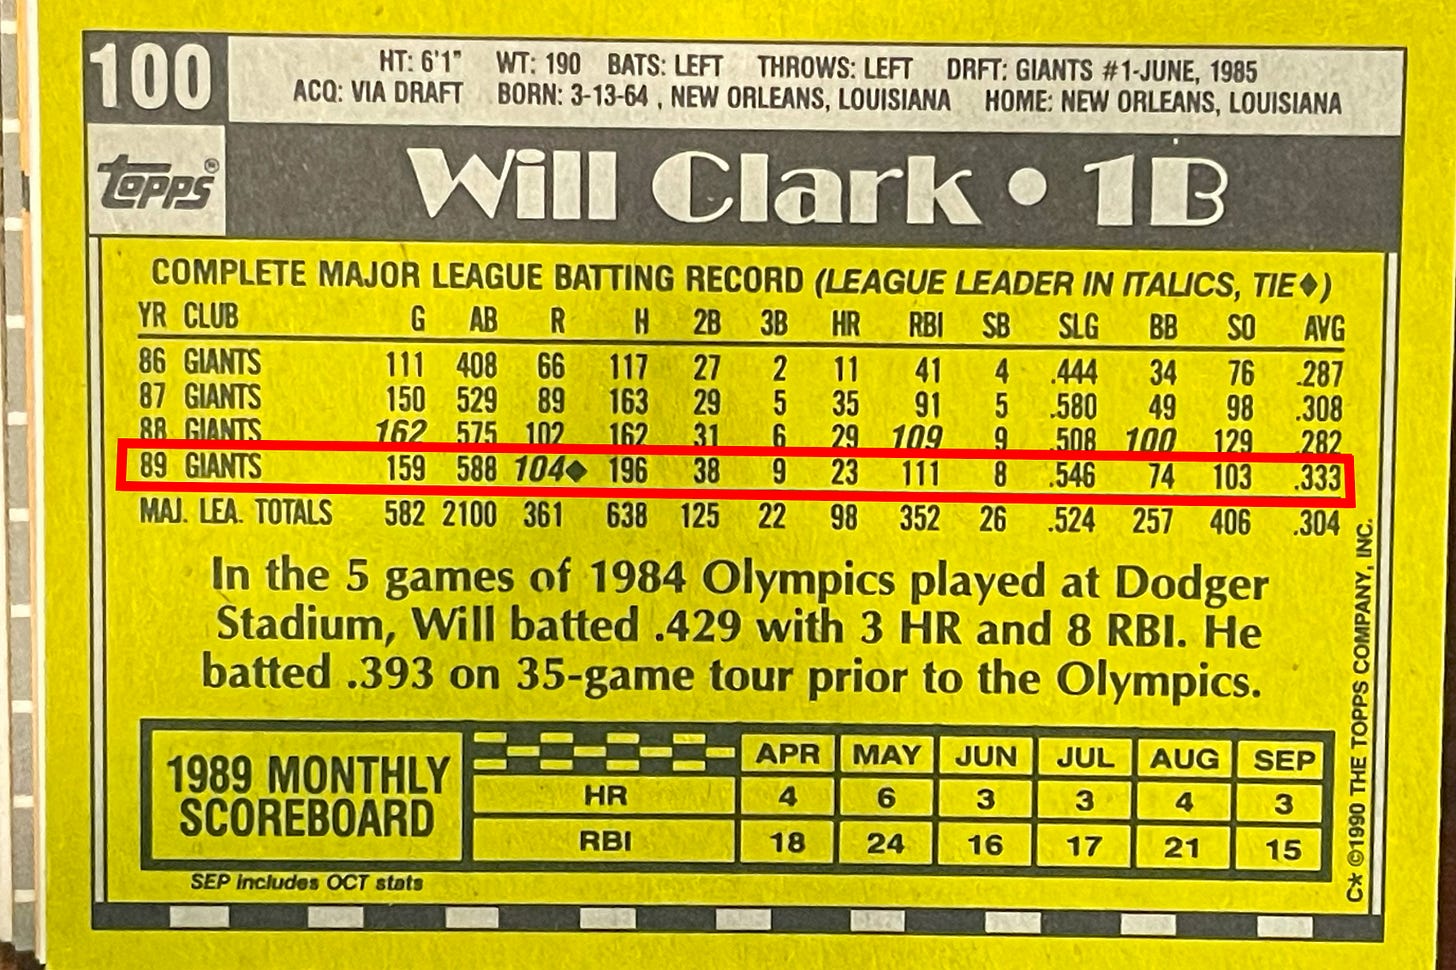
We’re going to do it using Will Clark’s stat line from the 1989 season when The Thrill was at the peak of his powers.
BATTING RUNS
For 120 years, batting runs were calculated as such: player runs 360 feet and touches all four bases before getting tagged out and that adds one (1) run.
Well, now it is modernized:
wRAA + (lgR/PA – (PF*lgR/PA))*PA + (lgR/PA – (AL or NL non-pitcher wRC/PA))*PA
Ah, more formulas. The wRAA is the main number here. The other things are minor adjustments to account for league and park factors. Let’s see:
wRAA: Weighted Runs Above Average
wRAA = ((wOBA-lgwOBA/wOBA Scale) * PA
wOBA (weighted on-base average):
So that got complicated. wOBA is the real main statistic for batting runs, it just happens to also need to be adjusted to the league environment. Why is an unintentional walk worth 0.69 but a hit by pitch is worth 0.72? You’ll have to ask NASA. As far as I know, they both advance the batter and all baserunners one base. I guess they give you extra “wOBAs” for the bruise? They explain here how these weights assign a run value to batting events, relative to the value of an out (which is a negative value).
While it’s unlikely, what if two hitters both had 100 singles? But one had 100 bunt singles with no one on and two outs. That’s 100 x 0.89. But so are 100 hard-hit line drives with two outs into the corner that a runner on first is already in motion and scores on, but the left fielder plays the ball perfectly and holds the slower hitter to a single. That’s also the same value in this batting runs formula. I mean… the line drive hitter is gonna drive in 100 runs and the bunter won’t get any, but… I’m still learning these things so I will put my hand down.
These weights in front of each event can change in different eras, but let’s just use this for now. So Will Clark’s 1989 wOBA was:
Now we take that .406 and subtract out the league-wide wOBA for 1989 multiplied by the scale. Huh?
Those numbers can be found here: https://www.fangraphs.com/guts.aspx?type=cn
In 1989 the league-wide wOBA was .313 and the scale factor was 1.329.
Okay, so let’s plug it into the wRAA formula now:
Now we’ve gotta add the league and park adjustments. Candlestick Park has gotta add some I bet.
I grabbed the non-pitcher league data from this search
We have what we need:
Let’s do the math:
Batting Runs = 47.2 + (0.109 – (0.96*0.109))*675 + (0.109 – (7,536/68,921))*675
Batting Runs = 49.9
So we now can say Will Clark in 1989 was worth 49.9 batting runs above average. His on-base percentage for 1989 0.407 and his wOBA was 0.406. But OBP is simply calculated as times on base divided by total plate appearances. wOBA is the same idea but requires a calculator that costs 10x more.
Will Clark, who scored 104 runs and drove in 111, was worth 49.9 batting runs.
We have one piece of the puzzle:
WAR = (49.9 + Base Running Runs +Fielding Runs + Positional Adjustment + League Adjustment +Replacement Runs) / (Runs Per Win)
BASE RUNNING RUNS
Time for piece #2 of the puzzle. Base running value. My hypothesis is that this won’t add much to Will Clark’s WAR. He had 67 stolen bases in his career and got caught 48 times. That isn’t good. But let’s see where this takes us. The formula takes a statistic called Ultimate Baseball Running (UBR) and Weighted Stolen Base Runs (wSB). Well, UBR is one of the secret sauces. It is calculated using video data by a company named Baseball Info Solutions. It summarizes into a chart like so:
So since video was much less prevalent in 1989, we’ll have to guesstimate. Let’s call Will Clark “Below Average” (I know, I know, blasphemy). So the first part of the equation will start at -1.5. Now for stolen bases.
Here’s the formula, get ready for more letters where numbers should be:
wSB = SB * runSB + CS * runCS – lgwSB * (1B + BB + HBP – IBB)
Well, runSB is a constant of 0.2 for every season since Abner Doubleday invented the sport, so at least we know that. Will Clark had 8 stolen bases and was caught stealing 3 times. So now we just need to calculate runCS and lgwSB.
runCS = -1 (2 * RunsPerOut + 0.075)
RunsPerOut is runs divided by outs in an entire season, so in 1989 that’s 17,405 runs and 113,144 outs:
-1* (2 (17,405 / 113,144) + 0.075)
runCS = -0.38
lgwSB = (lgSB * runSB + lgCS * runCS) / (lg1B + lgBB + lgHBP – lgIBB)
Now we have everything to plug in here:
((3,115 * 0.2) + (1,441 * -0.38)) / (26,035 + 13,528 + 801 - 1,447)
lgwSB = 0.0019
Now we have every number we need for wSB:
(8 * 0.2) + (3 * -0.38) - 0.0019 * (126 + 74 + 5 - 14)
Will Clark’s wSB in 1989 was 0.82.
Now we add that 0.82 to his “below average” UBR and his Base Running Runs is -0.68
We have two pieces of the puzzle:
WAR = (49.9 + (-0.68) +Fielding Runs + Positional Adjustment + League Adjustment +Replacement Runs) / (Runs Per Win)
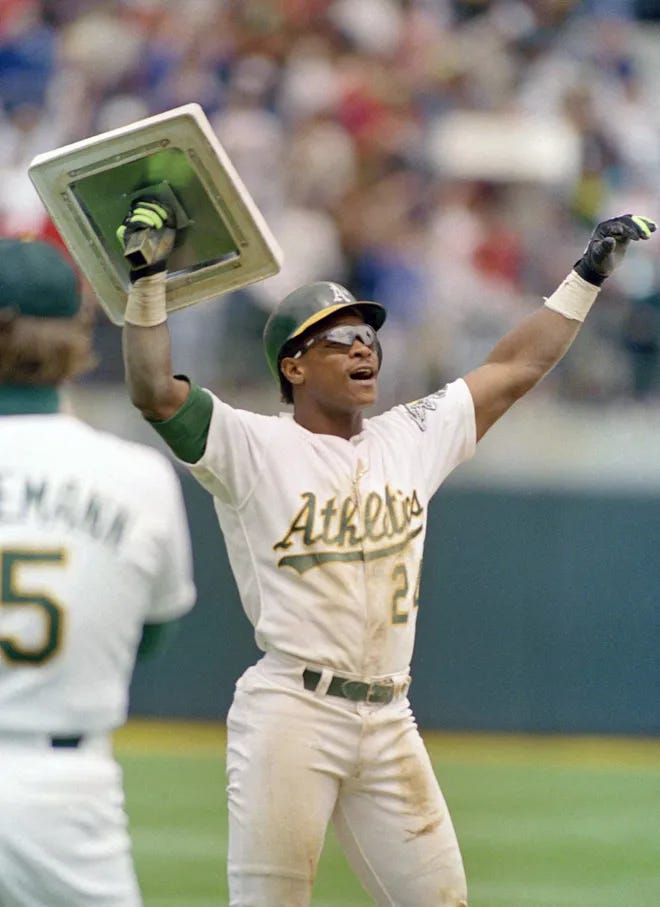
I take it that we’re trying to calculate the value of a stolen base with that last formula, and divide it by likely stolen base opportunities. A single, walk or hit by pitch will often have you on base with an empty base at second. An intentional walk is usually done to set up a force play, so that would block any stolen bases. And since second is the easiest base to steal, that’s all they’re worried about. Did they not consult Rickey Henderson? All bases are ripe for the plucking.
FIELDING RUNS
So we just had one subjective stat thrown in with UBR. Now we have fielding runs, which is also a hazy science. The simple fielding percentage statistic of errors divided by total chances is not good enough. Neither is a count of how many SportsCenter Top 10 catches you make. So it’s time for Ultimate Zone Rating (UZR) to enter the chat. The background of UZR is here: https://library.fangraphs.com/defense/uzr/. But it looks like another observational stat done by Baseball Info Solutions.
It looks like this statistic means more to the “athletic” positions, like the three outfield spots, shortstop and second base where range and arm strength are important. Plays are credited or penalized based on whether they are made into outs or not. And the expected run value of the play is then credited or debited to their fielding runs value. A first baseman who scoops, stretches and picks errant throws but still records the out does not get any credit for his fielding in this stat.
Well, Will Clark won a Gold Glove in 1991. In 1989, Andres Galarraga won the NL Gold Glove for the Expos. How can you compete with a man nicknamed “The Big Cat”? So he’s getting a +15 from me, Gold Glove caliber. End of debate. I never saw him make an error, so it didn’t happen. Now we have the next piece of the puzzle done.
WAR = (49.9 + (-0.68) + 15 + Positional Adjustment + League Adjustment +Replacement Runs) / (Runs Per Win)
POSITIONAL ADJUSTMENT
This one drives me nuts. There’s a value adjustment for each position popped into these formulas. Apparently this one is designed to get the positions evened out. As in, the Fielding Runs component is about comparing yourself to your peers at your position. This normalizes that component so all positions can be compared. It uses the position run value times innings played at the position. Will Clark played 1,374 innings at 1B in 1989.
My unbiased judgement had Will Clark at +15 UZR, or 15 runs better than the average first baseman. Now to compare him to everyone else, we take 12.5 runs off the top, because all the footwork, coordination and reaction time at first base is worth the least on the field, apparently.
Positional Adjustment = ((Innings Played / 9) / 162) * position run value
((1,374 / 9) /162) * -12.5
-11.78
Let’s plug this bullshit in now.
WAR = (49.9 + (-0.68) + 15 + (-11.78) + League Adjustment +Replacement Runs) / (Runs Per Win)
LEAGUE ADJUSTMENT
This is like a correction statistic. Like when a spacecraft fires it’s boosters for a split second to fix its heading. It is designed to balance each league’s average values for the other stats we have calculated so far. It’s usually a miniscule adjustment, but the formula isn’t miniscule:
League Adjustment = ((-1)*(lgBatting Runs + lgBase Running Runs + lgFielding Runs + lgPositional Adjustment) / lgPA)*PA
League Adjustment = ((-1)*(-547.7 + 0.2 - 10.0 + 399.3) / 73,829 ) * 675
League Adjustment = 1.45
WAR = (49.9 + (-0.68) + 15 + (-11.78) + 1.45 + Replacement Runs) / (Runs Per Win)
REPLACEMENT RUNS
This adjusts the player’s performance relative to replacement level using Runs Per Win. Position players are calculated as 570 WAR per 2,430 games. I don’t know how, exactly. I do know the 2,430 is the number of MLB games in a full 162-game season with 30 teams. But 570? That makes 0.2345678 WAR per game. I’m not sure what that means. And Runs Per Win is another one of those stats we have to grab from the Guts! page at Fangraphs. For 1989, that’s 9.23. So here’s the formula:
Replacement Level Runs = (570 * (MLB Games/2,430)) * (Runs Per Win/lgPA) * PA
Replacement Level Runs = (570 * (2,106/2,430)) * (9.23/160,033) * 675 (note: the MLB games is fewer because in 1989 there were 26 teams)
Replacement Level Runs = 19.23
WAR = (49.9 + (-0.68) + 15 + (-11.78) + 1.45 + 19.23) / (9.23)
Now we can calculate Will Clark’s 1989 WAR. I hope it’s close, but I remember my math tests. Close isn’t good enough.
His WAR is…
7.9!
Was I close? FanGraphs lists his actual 1989 WAR as 8.1, a rounding error. Give me my A+! I didn’t look at his 1989 WAR before starting this so I wasn’t sure I was close.
CONCLUSION - IS THIS A GOOD STAT?
I mean, we have to trust the statisticians that all the adjustments and linear weights are accurate. the baserunning and fielding stats are highly subjective from what I noticed.
While baserunning seems to top out at +/- 1 WAR on average, baserunning does win or lose games. It’s a speed, timing and instinct thing. It’s how to slide correctly, follow your coach’s instructions and read the play. Look at one of the greatest first to home plate dashes ever:
And now one of the worst:
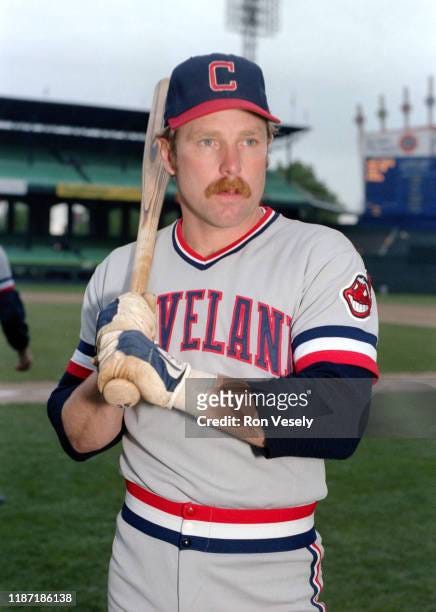
When you boil it down to this UBR number, and add in the weighted stolen base stat, that negates a lot of value I’d say. When Rickey Henderson stole 130 bases in 1982, his base running runs value was 9.5 and his overall WAR was 5.8. The runs per win value in 1982 was 9.454, meaning his base running runs, in the season the greatest base stealer of all time set the record for most steals in a season, only added 1 Win above replacement to his total (9.5 / 9.454). His season was deemed as valuable as Toby Harrah, third baseman for the Indians. They both had an OBP of .398, but Rickey stole 113 more bases.
Now for the fielding. I think today’s players get dinged a lot more on this, and the further back in time you go, the fuzzier it gets. Players now are graded on high-tech cameras that plot your position versus where a ball is hit and judges you on if you should’ve made the play or not. That used to be scorekeepers calling things errors or base hits, but that was notoriously open to bias. Errors are kind of like pornography, you know it when you see it. As for the ratings? I mean, we know Brandon Crawford is a Gold Glove shortstop. In this Statcast era, his defense is routinely graded at 10 to 15 runs above average. We also know Ozzie Smith was the greatest shortstop in the field of all time. His defense usually rates in the 20’s for his career, with a high of 40! While in the 80’s every game wasn’t on tv and batted balls, shifts and pitches weren’t tracked to the degree they are now, that sounds right.
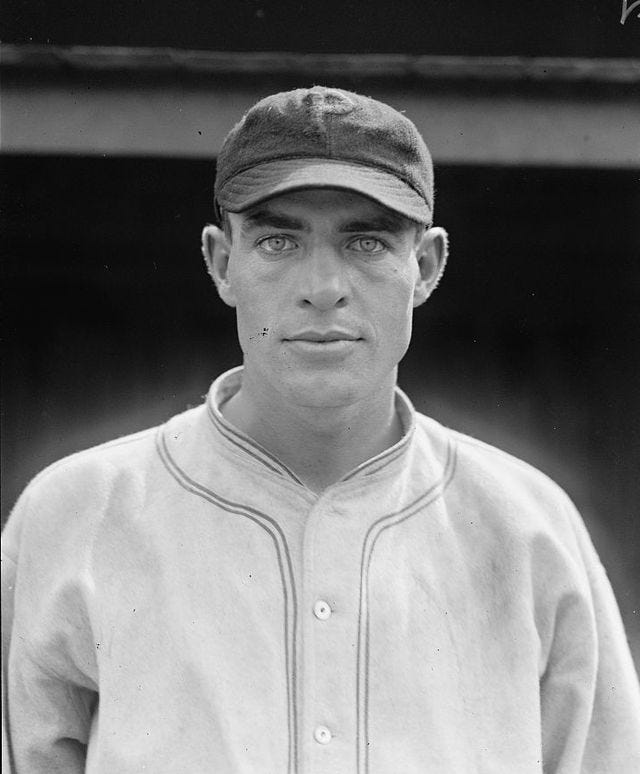
Now what about Glenn Wright? He was a shortstop in the 20’s and 30’s for the Brooklyn Dodgers and Pittsburgh Pirates. Had a decent enough career, played over 1,000 games, batted .294 with a .447 slugging percentage.
He played 1,051 games at shortstop, including 153 at the position for the 1925 World Series champions, so he had to be doing something right there.
Look at his defensive value. It’s all over the place. Because no one really knows. His value has 3 seasons over 23 runs, 4 seasons below 2 runs and 4 seasons in between. And it’s not a linear progression like you’d expect with age, it’s up one year, down the next. Some of that is games played. He had a .941 fielding percentage as a shortstop from 1924 to 1933. That’s pretty good, but how do we know? Compared to watching Dansby Swanson snag a ball up the middle and tacking on 0.44 runs saved, how do we know that Glenn Wright was good or bad relative to his peers? Is there any adjustment for the progression of eras as fields became more uniform and better maintained and gloves became more reliable?
FINAL CONCLUSION
I wanted to tackle more in-depth stats this year. When I see advanced stats as a baseball fan, sometimes they stick, sometimes they just go right through my brain like the middle chapters of a Calculus text book. I thought finding WAR would be a good start, because it’s such an important number these days. What I discovered is that it’s still flawed. It’s better than the raw numbers, because it does account for different offensive environments of different eras (think back during segregation, or pre-expansion, or steroids).
But while hitting statistics have been analyzed and calculated to the millionths of a percentage point, the other aspects of the game for position players is still an educated guess. There are so many data points on pitches and batted balls that smart analysts can almost predict what’s going to happen any given pitch, as far as where the ball will go. Look at how crazy shifts got the past decade.
I still can’t shake my “eye-test” bias, though. If I see a player make amazing athletic plays, like Alek Thomas in center field for the Diamondbacks, I picture him as a Gold Glove caliber outfielder. But I don’t analyze his first step, reaction time, sprint speed, route efficiency like they do now. I just watch. I see a ball that looks impossible to catch get flagged down with ease. But Fangraphs listed his fielding as 0.5 runs above average in 920 innings in center field. Welp.
I think… I should’ve stayed awake more often during that MWF 8:00am statistics class freshman year at Cal Poly. Then maybe I could explain this better.
Should I look at the pitching formula?


